
Financial KPI Dashboard Infographic Infographic Element
Premium
Subscribe to unlock unlimited access to 551700+ premium assets
Share:
Authorization required
Added to collection Add to collection

Short description:
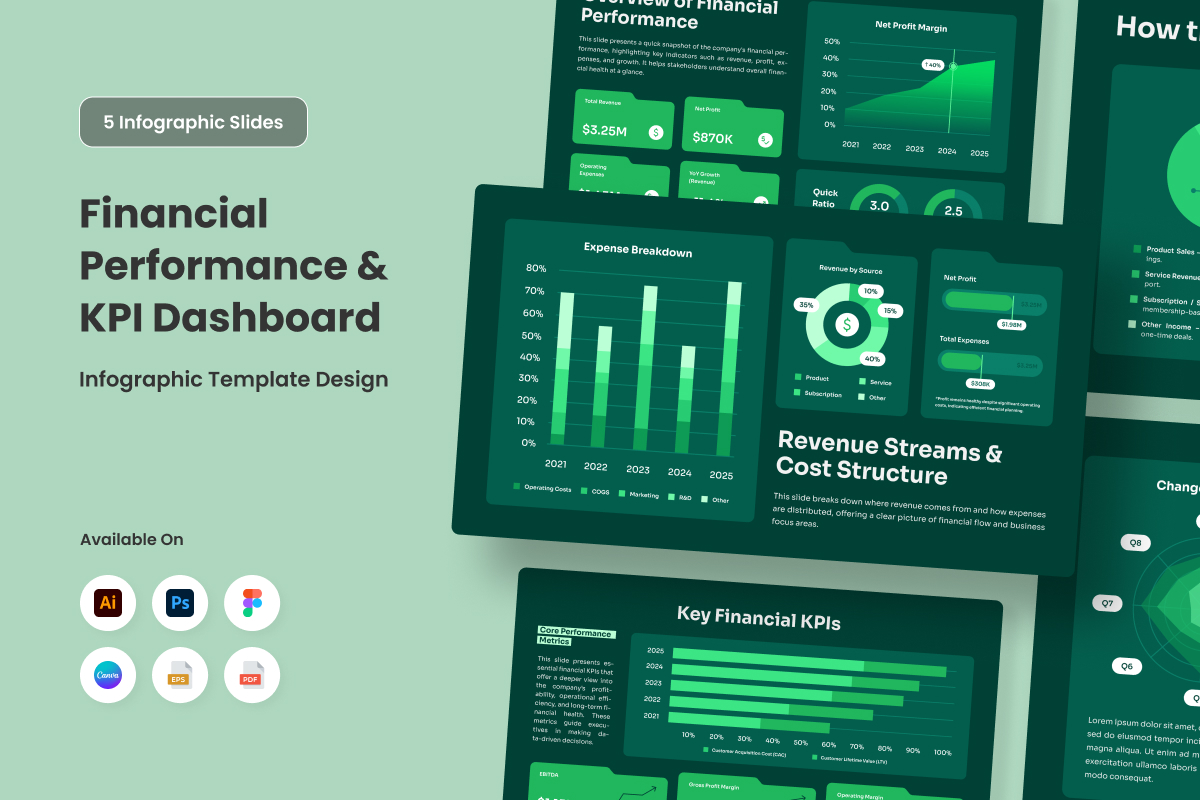
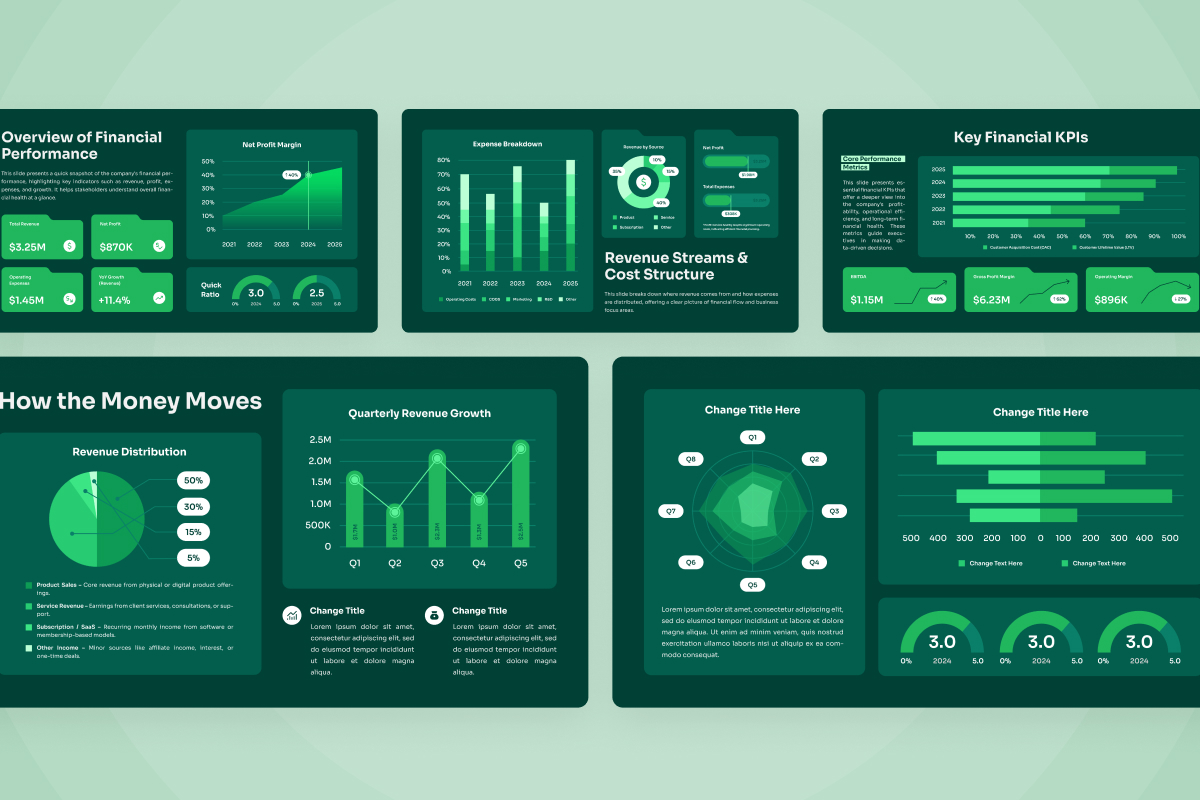
Present your company’s financial insights with a sleek KPI dashboard infographic. Designed for business reports and investor presentations, this layout helps visualize revenue growth, profit margins, and performance trends with clarity. Ideal for financial analysts, marketers, and design professionals looking for a modern and editable visual report.
**Highlights:**
- 5 Infographic Design Variations
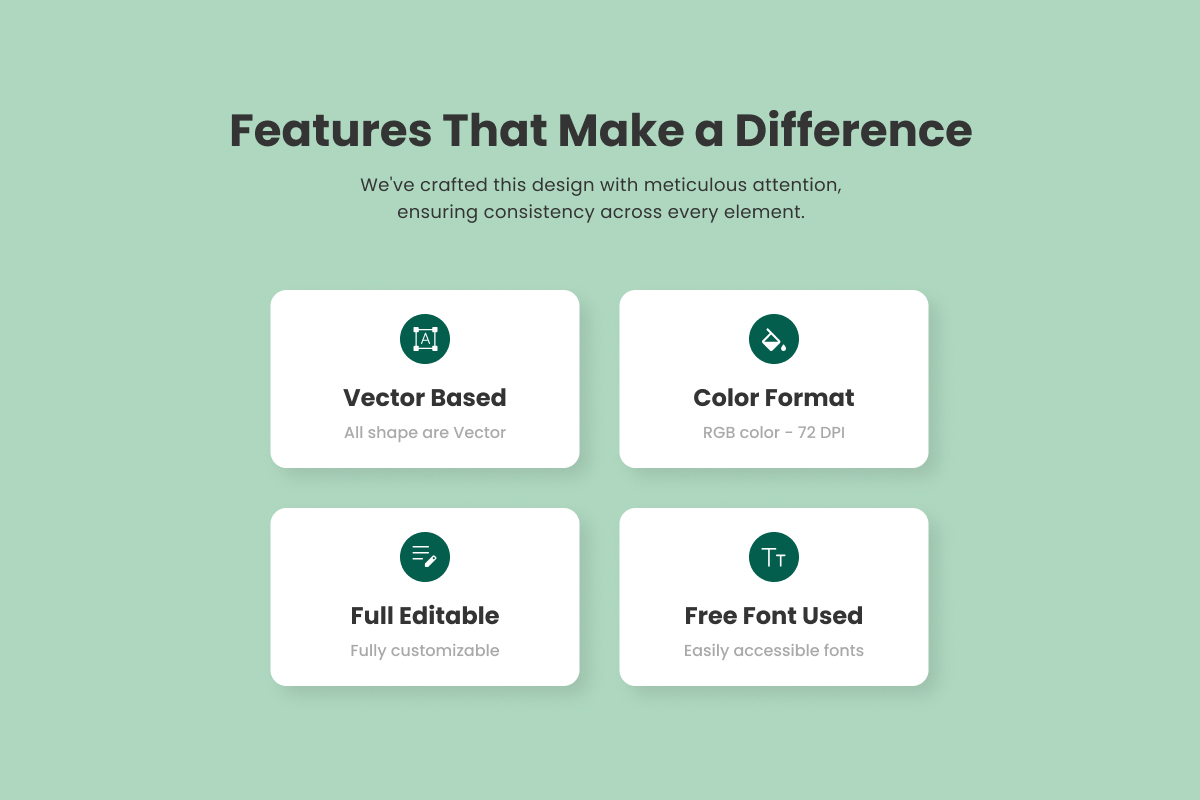
- Fully Layered and Editable
- Fully Customizable (text, color, & objects are editable)
- Free Fonts Used
- RGB, 72dpi
**Includes Files:**
- Adobe Photoshop Files (.PSD)
- Adobe Illustrator Files (.AI)
- EPS Files (.EPS)
- Figma Files (.FIG)
- Canva Link (.TXT)
- PDF Files (.PDF)
- Readme Files (Font Info)
Show more hide
Similar Graphics
see all
Authorization required

Authorization required

Authorization required

Authorization required

Authorization required

Authorization required
More From twinletter
see all
1 Authorization required
1 Authorization required
Authorization required

Authorization required

Authorization required

Authorization required
Additional info